Produce. Defend. Decide.
Innovatio Decision Suite structures the trade-offs that turn analysis into decisions.
From framing to the final decision.
Select your context to connect your deliverables, trade-offs and the relevant Innovatio Decision Suite modules.
Choose your level, then your business context.
The grid shows how Innovatio Decision Suite supports each client family from data structuring to decision governance.
Select your context to connect your deliverables, trade-offs and the relevant Innovatio Decision Suite modules.
Diagnostics, benchmarks, segmentation and portfolio analyses.
Where to play, how to invest and how to steer strategy over time.
Strategic vision, cross-functional priorities and investment scenarios.
Where to invest, which risks to accept and which priorities to set.
Markets, segments, prices, volumes and commercial investments.
Which marketing and sales levers to prioritize.
Assumptions, profitability scenarios and investment dossiers.
Which projects to fund and under which assumptions.
Opportunities, usage segments and product hypotheses.
Which products to build, accelerate or stop.
Flows, dependencies, ESG data and continuity plans.
Which risks to address and which dependencies to secure.
Business model, cash trajectory, funding scenarios and investor milestones.
When to finance, under which assumptions, and with which milestones.
Seven modules, one shared logic.
You already have the building blocks — projects, intuitions, figures and levers. Innovatio Decision Suite turns them into decisions.
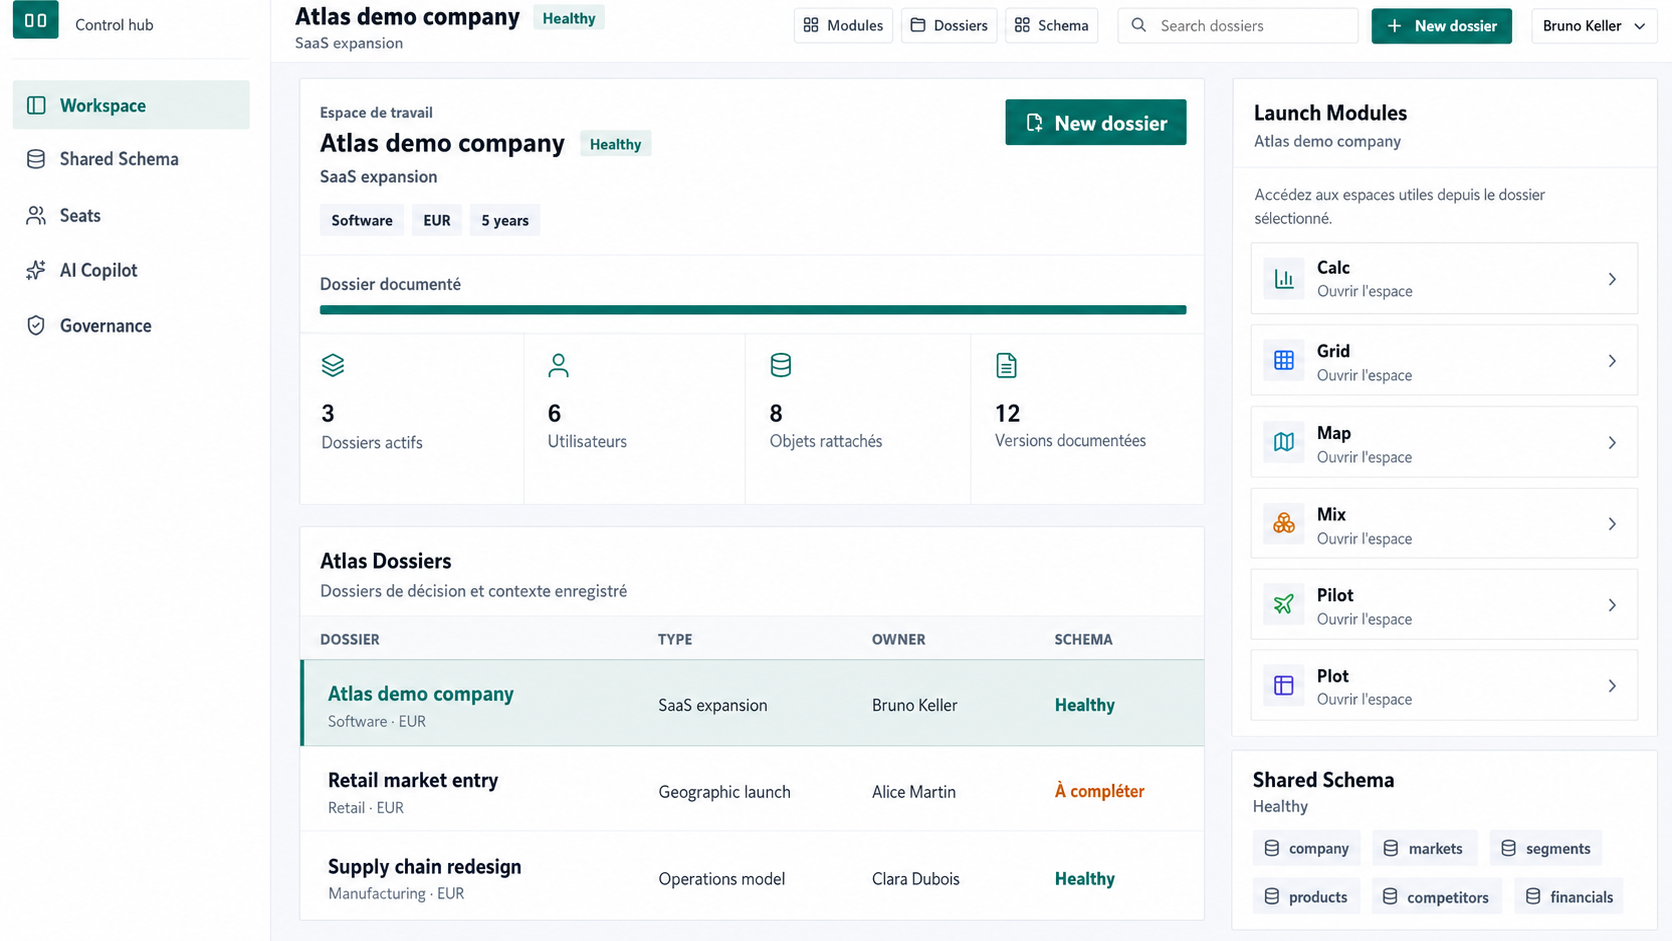
You already have active projects, scattered files, analyses spread across several tools and teams moving in parallel. <b>Atlas</b> brings together the information that the team explicitly records or attaches to a shared strategic decision file.
Discover →You already have market intuitions, field feedback, commercial data and development ideas. <b>Grid</b> organizes them to help you compare your options clearly: which markets to target, which segments to prioritize, which products to promote and which scenarios are worth investigating.
Discover →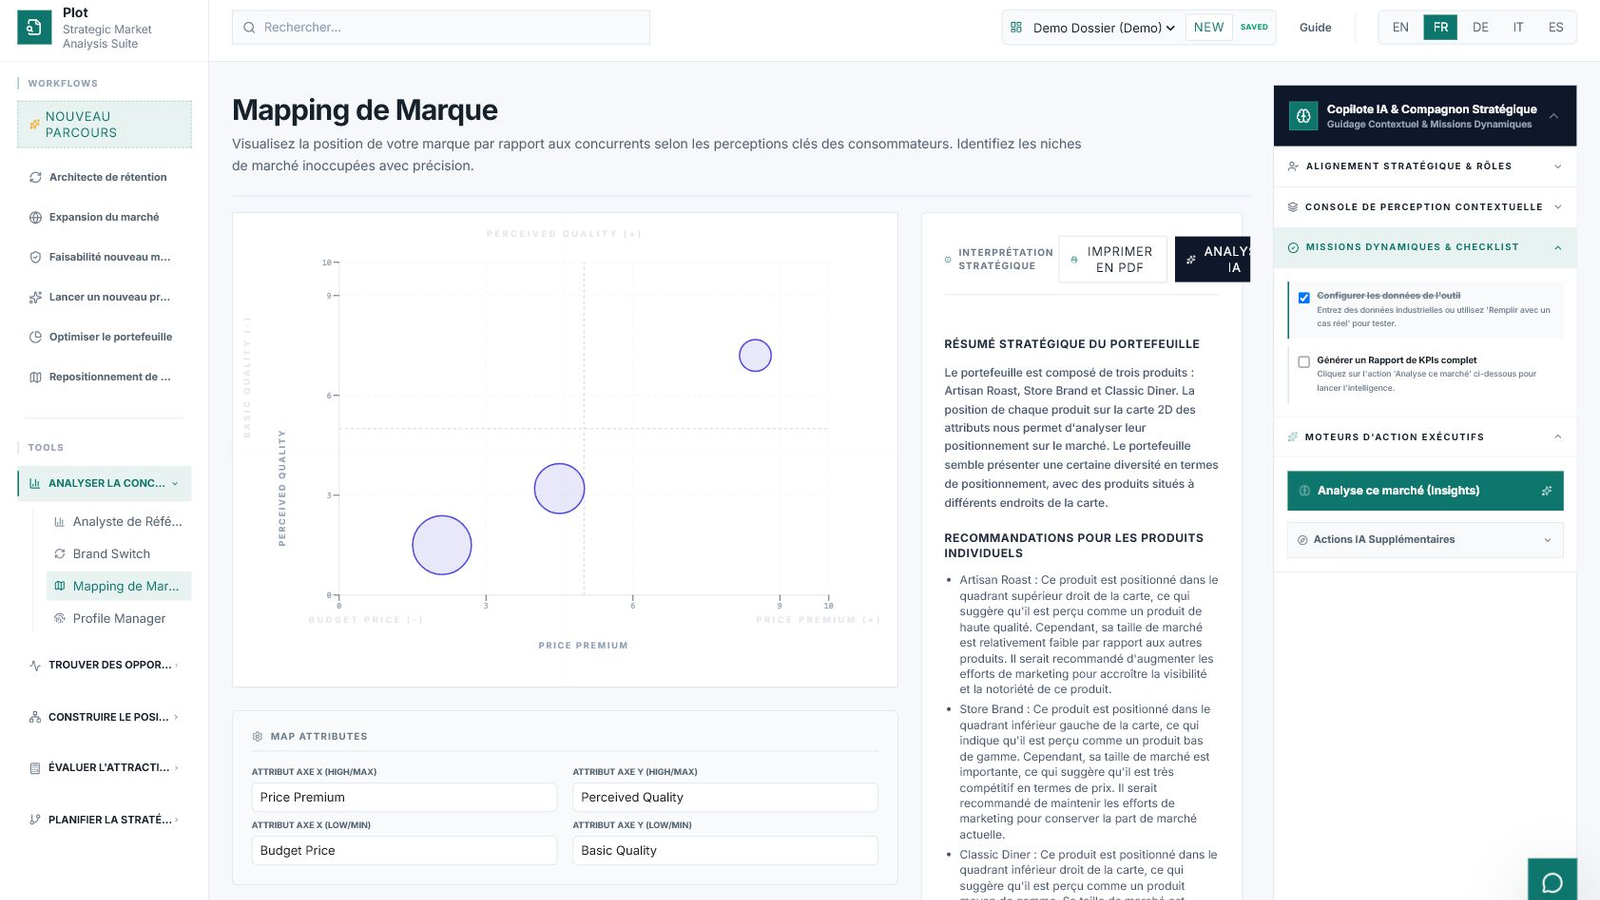
You already have several strategic options — markets to explore, brands to assess, growth opportunities — and plenty of data to discuss them. <b>Plot</b> puts them into perspective so you can compare them and prepare a recommendation.
Discover →You already have commercial levers — prices, volumes, promotions and discounts — and an idea of their effect. <b>Mix</b> quantifies them so you can estimate their impact on margin and performance before deciding.
Discover →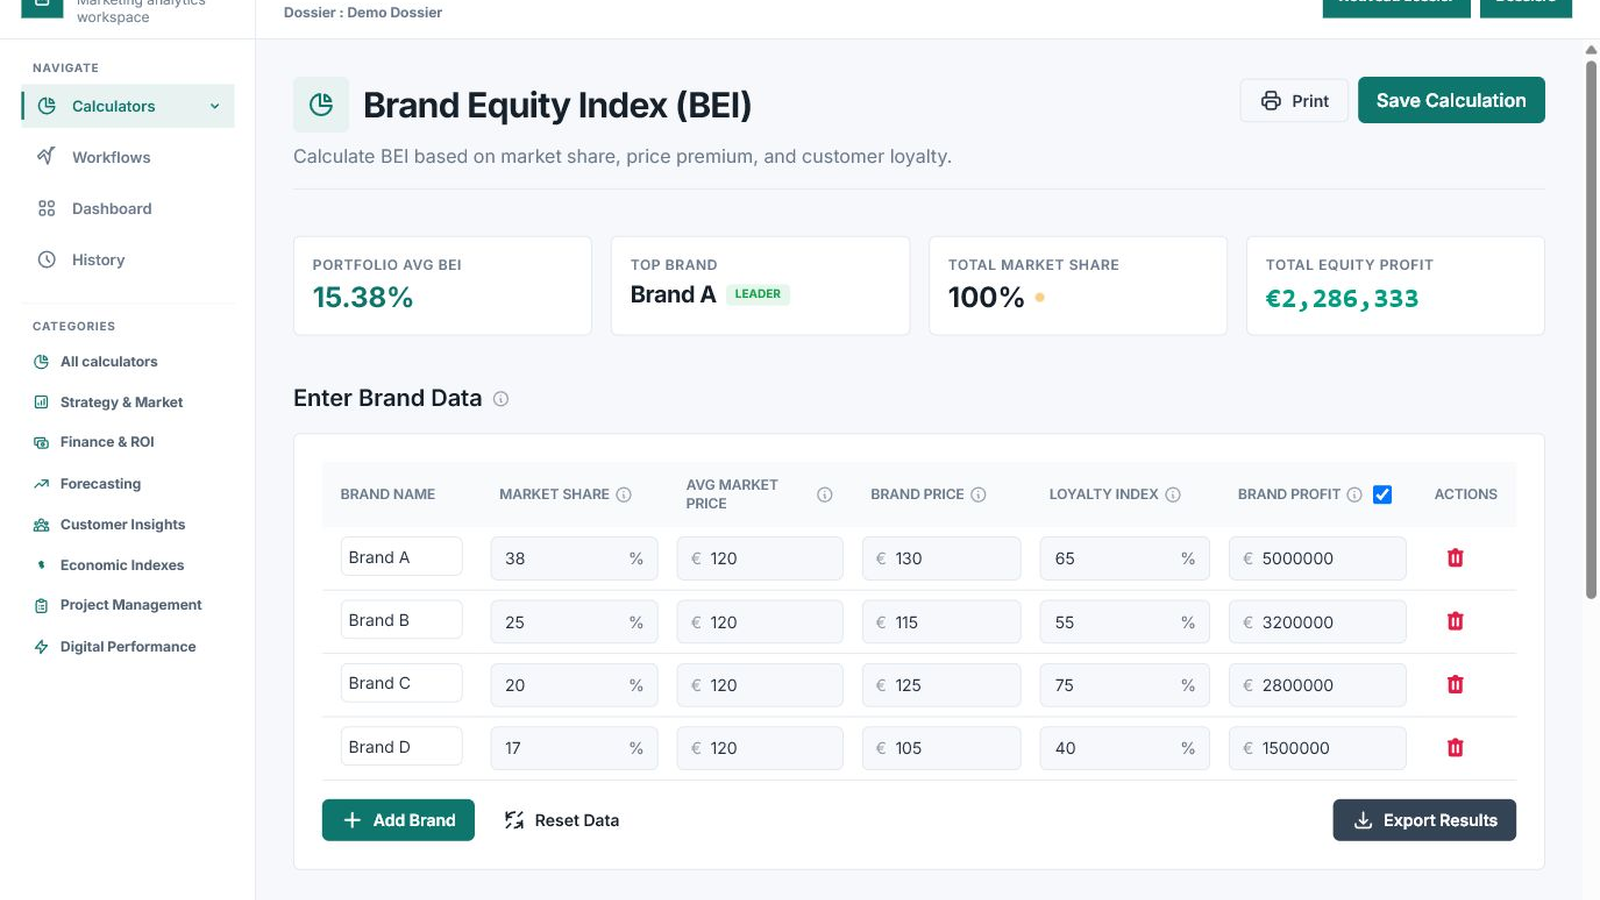
You already have figures, assumptions, Excel sheets and commercial or financial estimates. <b>Calc</b> structures them into normalized, documented and comparable calculations: ROI, profitability, break-even, growth, commercial performance, forecasts and differences between scenarios.
Discover →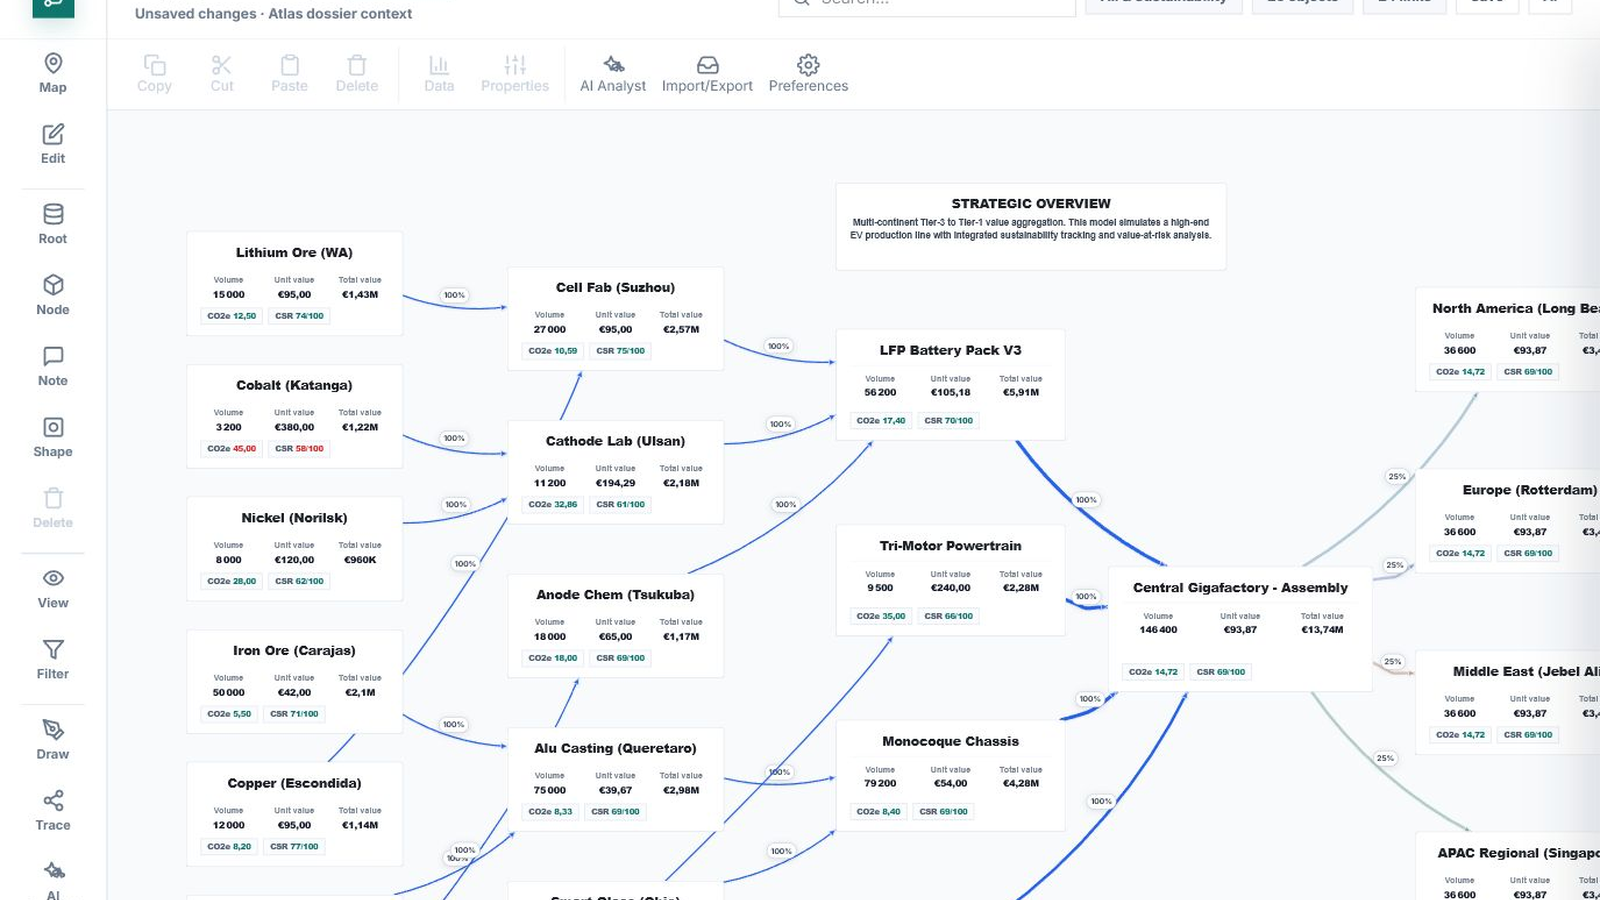
You already have field operations, suppliers, sites, logistics flows and risks that each team only knows in part. <b>Map</b> brings them together on an interactive canvas to reveal what previously remained in people’s heads or separate files.
Discover →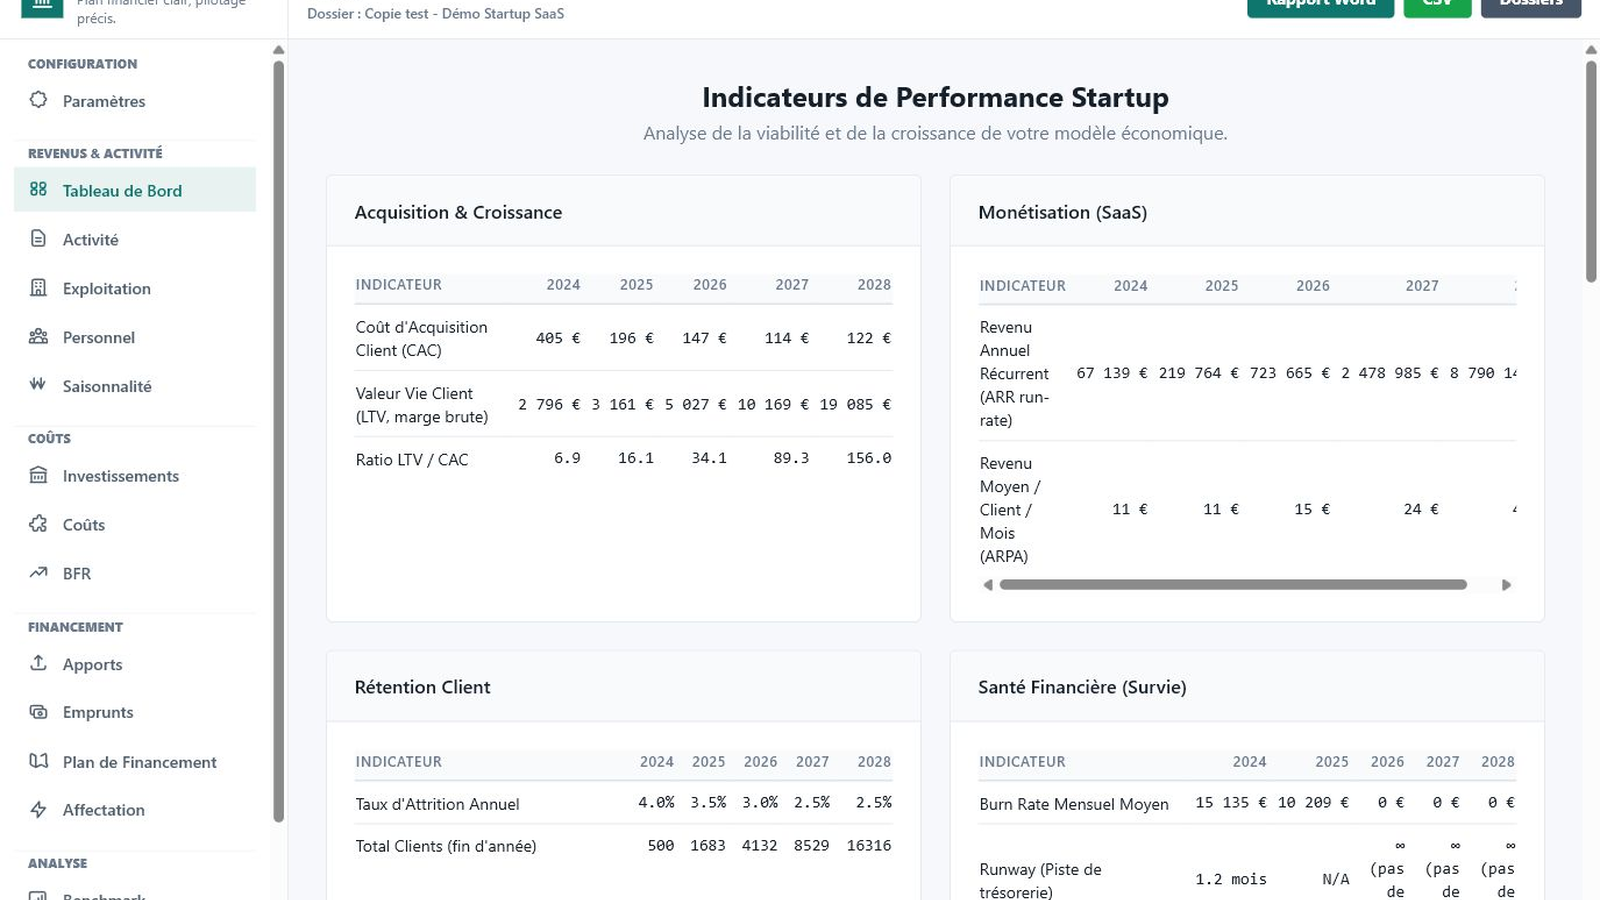
You already have a financial vision, activity assumptions and growth objectives. <b>Pilot</b> projects them over three to five years to build a quantified and defensible trajectory.
Discover →